This is the sixth and final installment in a six-part series on designing and building profitable EV charging stations.
In the first five parts, we covered how to identify high-demand locations, forecast growth, model energy costs, understand how incentives affect project economics, and determine the right station configuration. But even well-designed stations can fall short if the surrounding environment doesn’t support how drivers actually use them.
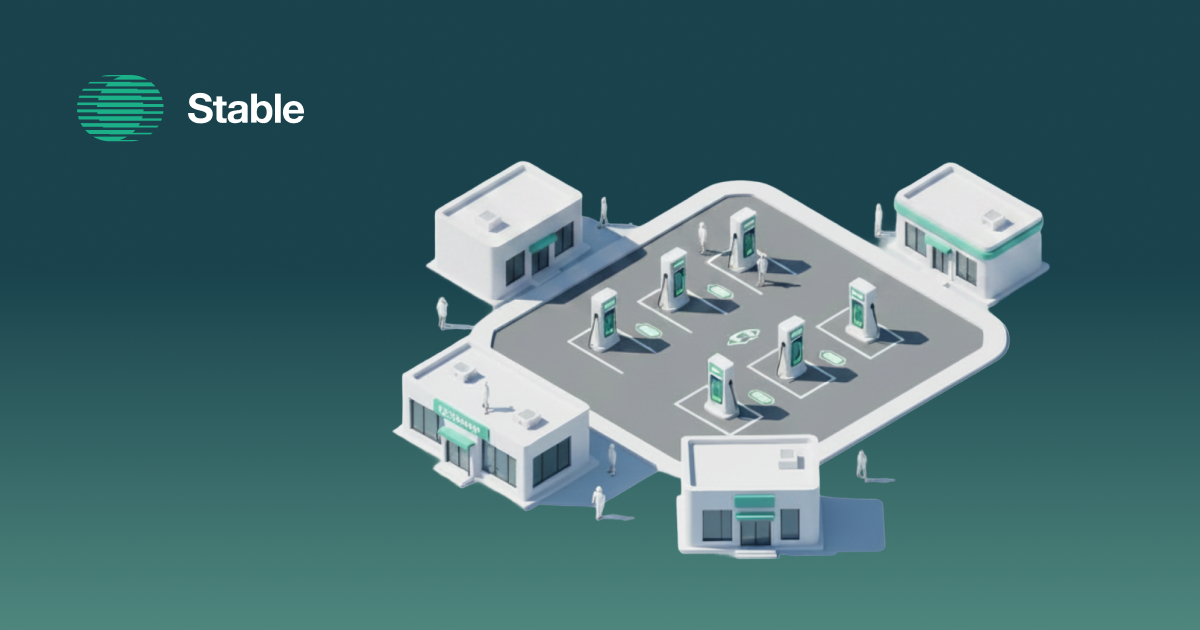
Site amenities influence where drivers choose to stop, how long they stay, and how stations ultimately perform. The difference often comes down to what’s around the charger, not just the charger itself.
They’re also often underweighted in investment analysis. Site amenities aren’t just nice-to-haves that improve customer experience. They fundamentally affect demand, influence optimal charger configuration, and can transform station economics when properly accounted for.
Understanding these dynamics is the difference between building a charging station and building a profitable charging business.
Amenities as demand drivers
When drivers choose where to charge, they’re not just looking for an available plug. They’re looking for a productive or pleasant way to spend their charging time. A station next to a coffee shop, restaurant, or retail store is fundamentally more attractive than an isolated station with nothing around it.
This isn’t speculation, it’s measurable in utilization data. Stable’s demand models factor in amenities within 500 meters of a charging location to account for their impact. Stations with strong nearby amenities consistently outperform isolated locations with similar traffic patterns and demographics. The amenity mix affects not just whether drivers stop, but how long they stay and how often they return.
Different amenities attract different driver segments. Quick-service restaurants appeal to time-conscious drivers on longer trips. Big-box retail draws shoppers who need 30 to 60 minutes anyway. Grocery stores serve routine charging needs for local drivers. Each amenity type creates a different demand profile with different implications for station design.
Matching charger speed to expected dwell time
Here’s where amenity analysis connects directly to the station sizing decisions we explored in Part 5. The optimal charger power level depends not just on what vehicles can accept, but on how long drivers want to stay.
At a highway travel plaza, drivers want to get back on the road as quickly as possible. Installing 350 kW chargers makes sense because speed is the primary value proposition. Drivers will choose your station over competitors specifically because they can add 200 miles of range in 15 minutes instead of 30. The premium hardware cost is justified by the competitive advantage and higher throughput.
At a big-box retail location, the calculus flips. Shoppers typically spend 45 minutes to an hour inside. A 350 kW charger would fully charge most vehicles in 20 to 30 minutes, potentially cutting shopping trips short as drivers return to move their cars. That’s bad for the retailer and may actually reduce your station’s attractiveness to drivers who don’t want the pressure of a fast-filling battery.
In these destination contexts, 150 kW chargers can make more sense. They’re less expensive, create lower demand charges, and better match the natural dwell time. For locations where drivers routinely stay more than an hour, think movie theaters, sit-down restaurants, or workplace charging, even 50 kW chargers might be the right choice. The slower speed isn’t a limitation, it’s a feature that aligns with how people actually use the site.
This alignment between charger speed and dwell time affects every aspect of station economics. Lower-power chargers cost less to install and operate. They create smaller demand charge exposure. And when properly matched to site context, they can deliver equivalent customer satisfaction at better unit economics.
Capturing the full value of foot traffic
For site hosts who operate businesses alongside charging infrastructure, the economics extend beyond electricity sales. Every driver who stops to charge is a potential customer, and for many businesses, the incremental revenue from that foot traffic exceeds the charging revenue itself.
Consider a convenience store that installs charging stations. A driver stopping for a 20-minute charge is highly likely to come inside, buy a coffee, maybe a snack. The margin on that $8 purchase might exceed the margin on the charging session. Multiply that across hundreds of sessions per month, and the charging infrastructure becomes a customer acquisition channel as much as a profit center.
This changes how you should evaluate station investments. A site that looks marginal when you only count charging revenue might be highly attractive when you factor in the business value of captive customers with time to spend. Retailers, restaurants, and service businesses should model both revenue streams, and often find that the combination justifies investments that neither would support alone.
The foot traffic value also affects optimal station sizing. A retailer might deliberately oversize their charging installation, accepting lower utilization per charger, because the real goal is maximizing the number of customers drawn to the location. The charging economics look different when they’re supporting a broader business strategy.
When adding amenities makes sense
Not every site comes with ideal amenities already in place. For operators developing stations at locations with limited existing infrastructure, adding amenities can transform site economics.
Restrooms are the highest-impact addition for highway and travel corridor locations. Drivers on long trips need bathroom access, and a station without restrooms will lose business to competitors that have them.
Canopies and shade structures matter more than many operators realize, especially in hot climates. Charging in direct sun is uncomfortable and can even slow charging speeds as vehicle thermal management systems throttle power to protect batteries. A canopy improves customer experience, can improve charging performance, and signals that the station is a real destination rather than an afterthought.
Lighting, security cameras, and basic landscaping all contribute to perceived safety and quality. Drivers, especially those charging at night, factor these elements into their station choices. The investment in site quality pays back through higher utilization and the ability to command premium pricing.
The decision to add amenities should be modeled like any other capital investment. What’s the expected utilization improvement? How does that affect revenue and unit economics? Does the improved competitive position justify the cost? For many sites, the answer is yes.
Integrating amenities into site analysis
Stable Evaluate incorporates amenity analysis directly into demand forecasting. By examining what’s within 500 meters of a potential site, the model captures how nearby businesses and services affect expected utilization. This isn’t a qualitative adjustment, it’s built into the quantitative predictions.
This means you can compare sites not just on traffic and demographics, but on the full context that determines whether drivers will actually stop. A location with moderate traffic but excellent amenities might outperform a high-traffic location with nothing around it. The model surfaces these dynamics rather than leaving them to intuition.
For operators evaluating charger configurations, the amenity context informs power level decisions. The platform helps you understand expected dwell times based on site characteristics, so you can match charger speeds to how drivers will actually use the location.
Bringing it all together
Site amenities are the final piece of the profitability puzzle, but they’re deeply connected to everything else we’ve covered in this series. Amenities drive demand (Part 1). They influence how that demand grows as the market matures (Part 2). They affect dwell time and therefore optimal charger configuration, which in turn affects energy costs (Parts 3 and 5). They can even influence incentive eligibility for community-serving locations (Part 4).
The operators and investors who build profitable charging networks understand these connections. They don’t evaluate sites on a single dimension or optimize decisions in isolation. They model how demand, costs, incentives, configuration, and amenities interact, because that’s where the real returns come from.
Building profitable charging stations isn’t about finding magic locations or gaming incentive programs. It’s about rigorous analysis that captures the full complexity of station economics. The tools exist to do this well. The question is whether you’re using them.
What’s next
This is the final part of the series. If you’ve been following along, you now have a framework for evaluating charging sites across demand, growth, costs, incentives, sizing, and amenities.
Ready to put it into practice?
Use Stable Evaluate to model how demand, costs, and site characteristics affect performance.
In this series:
Part 1: Choosing areas with the highest demand
Part 2: Forecasting growth
Part 3: Understanding energy costs
Part 4: Optimizing incentives
Part 5: Station sizing
Part 6: Site amenities (this post)
Schedule a demo
Schedule a 30-min time-slot with us directly, or send us a message if there's something else we can help with.