Energy is one of the largest costs in EV charging, but it’s also one of the least well understood.
Most operators know their average cost per kWh, but that number hides a lot of complexity. Energy costs aren’t just about how much electricity you consume, they’re also shaped by demand charges, usage patterns, and how spiky your load is over time, layered on top of complex tariffs with peak vs off-peak rates, riders, and load and power factors.
To make this easier to see, we built a new energy costs module into Stable Operate's Pro tier. It makes these dynamics visible at the site level, showing what energy is actually costing and how that flows through to pricing and margin. It also supports advanced tariff calculations powered by Genability from Arcadia, so costs reflect the full electricity bill, not just simple consumption and demand math.
When a large portion of energy costs can come from demand charges, driven by short periods of peak usage rather than total energy consumed, it makes understanding and managing energy costs much more complicated. This is why two sites with similar utilization and revenue can have very different cost structures. One might have relatively stable usage and low demand charges, while another might see sharp spikes that drive costs up significantly, even if total energy usage looks similar.
It also means that increasing utilization doesn’t always increase costs in the way you’d expect. In some cases, higher volume can actually lower your blended cost per kWh by spreading demand charges more efficiently across usage.
Consider these two sites:
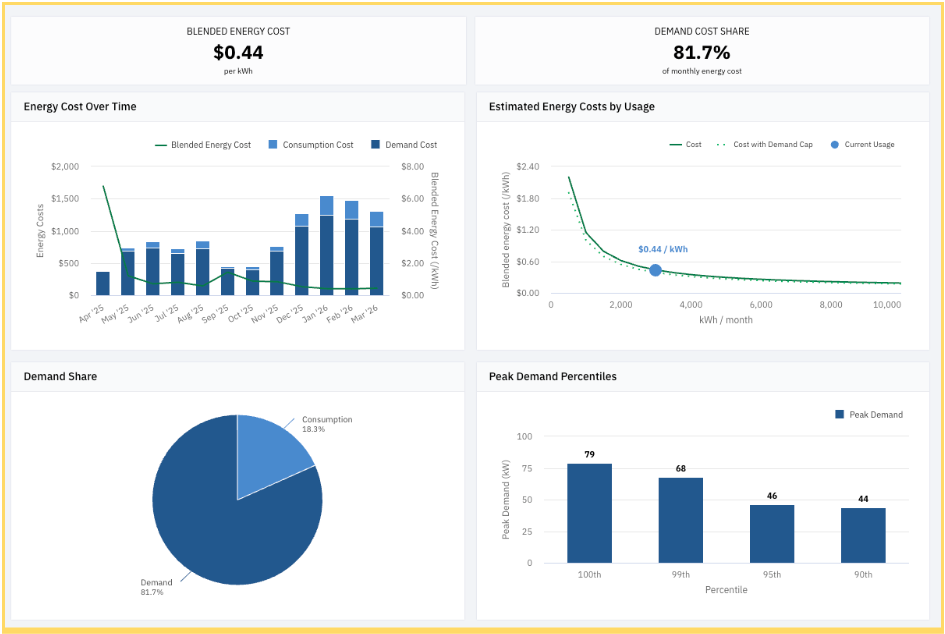
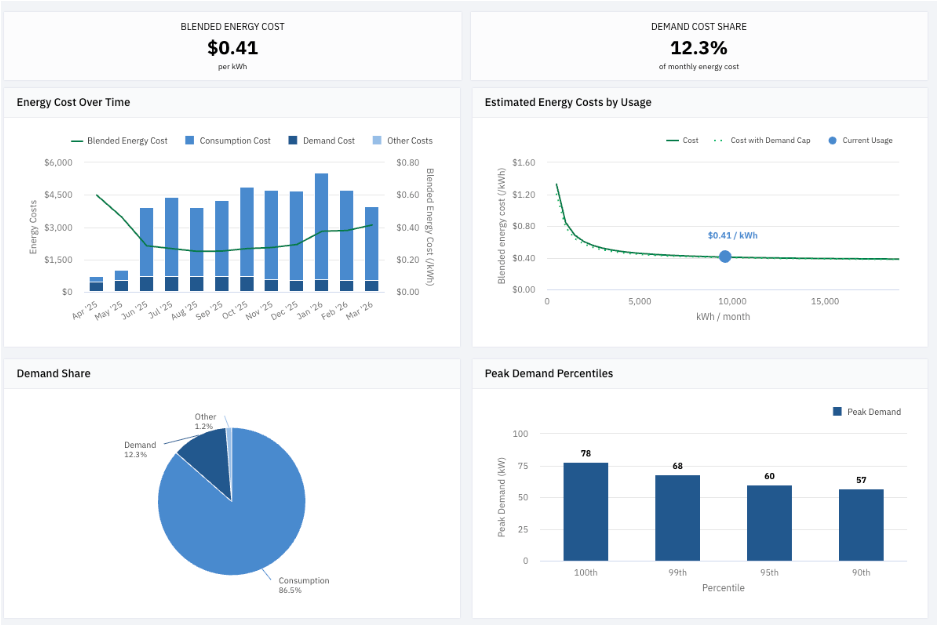
While these two sites have very similar blended energy costs and demand profiles, differences in their underlying tariffs mean they need to be managed very differently.
For the first site, where most of the energy costs come from demand charges, the right strategy might be lowering prices to drive up usage and lower the blended cost.
For the second site, that approach wouldn’t have much impact, because most costs come from consumption charges. Instead, the right strategy might be increasing prices to improve margin and implementing time-of-use rates that more closely align with the underlying energy costs.
Without visibility into how these dynamics play out at each site, it’s difficult to answer basic questions like:
- Are margins lower than expected because of pricing or energy costs?
- Which sites are most exposed to demand charges?
- Where would increasing utilization actually improve unit economics?
- Where do we need to adjust pricing to protect margin?
If you’re pricing or evaluating performance based on a single blended number without understanding what’s driving it, you’re missing a big part of the picture. And across a portfolio, that quickly turns into mispriced sites and meaningful margin leakage.
Want to see it in action?
The energy costs module is available in Operate's Pro tier, giving you a clear view of margins, not just top-line performance.
If you’d like to see how it works on your network, book a demo with our team.
If you’re new to Stable Operate, you can explore the Basic tier for free to get a feel for the platform and how we bring utilization and performance data together.
Schedule a demo
Schedule a 30-min time-slot with us directly, or send us a message if there's something else we can help with.