We’ve been expanding Operate with a set of new views designed to make it easier to understand what drives performance across EV charging portfolios. These updates bring more clarity to how sites are used, how pricing affects revenue, and how portfolio trends evolve over time.
Here’s a closer look at what’s coming next.
Summary views
A new Summary tab gives you a single-page view of your most important metrics. You’ll see uptime, utilization, sessions, revenue, and energy costs, along with trend charts for sessions, revenue, utilization patterns, and energy costs.
We also added a station list to the Summary tab. It shows current prices, recommended prices, idle fees, revenue, utilization, and nearby median pricing, making it easier to see which sites may benefit from a pricing adjustment.
Acquisition and retention
A new Drivers tab highlights how your network grows over time. You can track new vs returning sessions across the portfolio and compare user behavior across sites through a detailed table.
This helps operators understand which locations draw repeat users, which ones are attracting new traffic, and how that balance changes over time.
Energy cost analytics
The energy costs tab now includes two new cumulative charts: one showing total energy usage this month vs last month and another showing cumulative peak demand. Both charts update daily so you can see how usage and demand patterns evolve over the course of a month.
These views give operators clearer insight into how energy costs develop and where load patterns may be shifting.
Optimal pricing range
We updated the pricing tab with a modeled optimal pricing range. The new revenue curve helps you understand how expected daily revenue per charger changes as you adjust pricing, making it easier to identify where a price change may help or hurt performance.
Forecasting
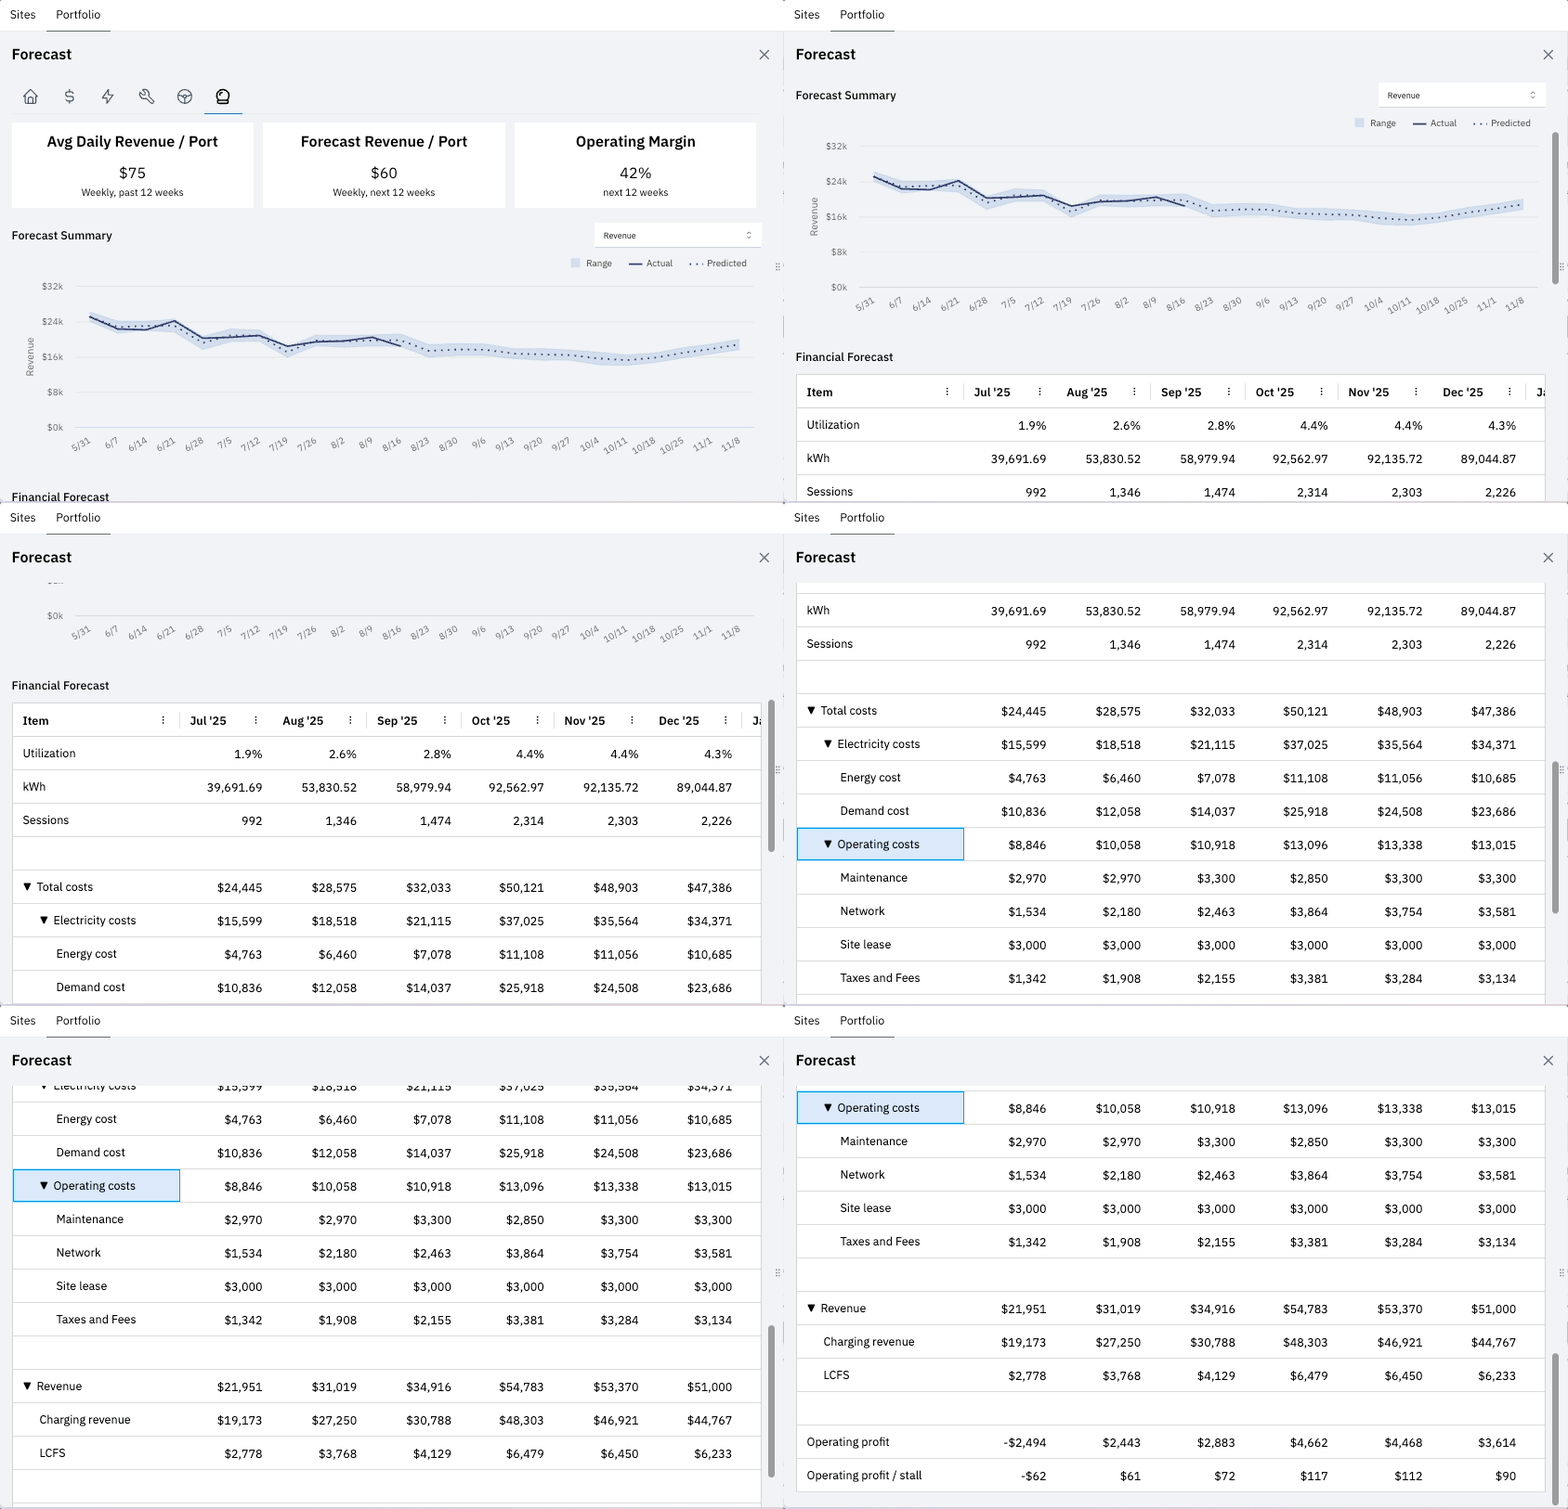
Operate now includes a dedicated Forecast tab. You can view projected revenue, utilization, sessions, and energy costs across your portfolio, and switch between these forecasts using a new chart picker.
This creates a clearer picture of how your network may perform under different conditions and helps operators plan ahead with more confidence.

These updates support our goal of making Operate the command center for network operations, with uptime, utilization, pricing, energy, and portfolio performance all in one place.
Interested in early access or want to share feedback?
Schedule a demo
Schedule a 30-min time-slot with us directly, or send us a message if there's something else we can help with.