Billions of dollars continue to flow into EV charging infrastructure, and nearly every project is backed by a utilization forecast. And yet, despite how central these forecasts are to investment and operating decisions, they’re rarely held up against reality.
Most predictions are built on limited data, unvalidated assumptions, or optimistic projections from operators without skin in the game. Investors are often given a simple number with little insight into how it was generated, what data it’s based on, or how it compares to real-world utilization.
At Stable, we believe forecasts should be transparent and defensible. That means continuously measuring our predictions against actual charging behavior and sharing what we find.
Real charging data at scale
Our demand estimation models are trained on actual charging behavior from tens of thousands of chargers across North America. This isn't survey data or industry averages. It's real utilization from operating stations, continuously updated as the market evolves.
We combine this utilization data with other geospatial datasets such as EV adoption trends, local demographics, competition analysis, and energy tariffs to generate site-level forecasts. But building a model is only part of the work. What matters more is validating those forecasts against what actually happens once chargers are live.
How we benchmark accuracy
Every quarter, when we update our model, we run a comprehensive benchmark comparing our predictions against actual utilization to surface bias, measure error, and improve performance over time, and we share the results with our customers.
We evaluate several key metrics:
Mean Absolute Error (MAE)
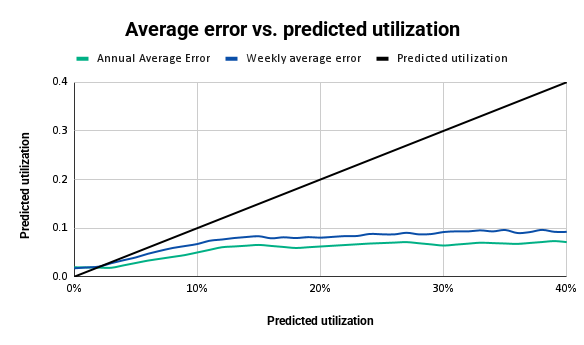
How far off are our predictions, on average, at the individual station level?
We measure this both weekly and on an annual, aggregated basis. On an annual basis, our MAE ranges from 2 to 7 percent depending on predicted utilization, and it does not increase for sites with predicted utilization above 10 percent.
Weekly MAE is higher, reflecting natural week-to-week variability in charging behavior, and ranges from 2 to 9 percent depending on predicted utilization.
Residual distribution
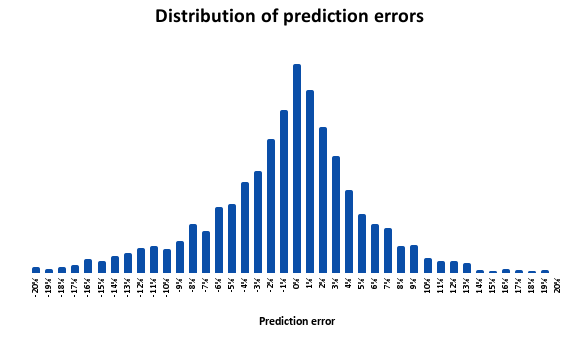
Are we systematically over- or under-predicting?
Our residuals center around zero, which indicates our forecasts are unbiased. We’re not consistently optimistic or pessimistic. In most cases, our predictions are within 3 percent of actual utilization. There is a longer tail on either side of that range, and within the long tail we’re more likely to underpredict. We underpredict by 5 percent or more 22 percent of the time, compared to overpredicting by 5 percent or more 15 percent of the time.
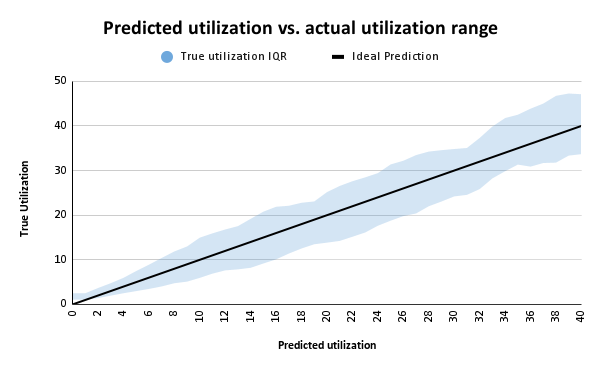
Inter-quartile range
Beyond average error, we look at the range of actuals versus what our model predicted to understand not just average error, but the typical error range.
Portfolio-level accuracy
This is where things get particularly relevant for investors evaluating multiple sites.
Why portfolio-level accuracy matters most
Individual station forecasts will always have some variance. A single site can outperform or underperform for reasons that are hard to predict: a new competitor opens nearby, a major employer relocates, or local EV adoption accelerates faster than expected.
But most investors aren’t betting on a single charging location. They're evaluating portfolios of 10, 25, or 50+ locations.
Here’s what our benchmarks look like at the portfolio altitude:
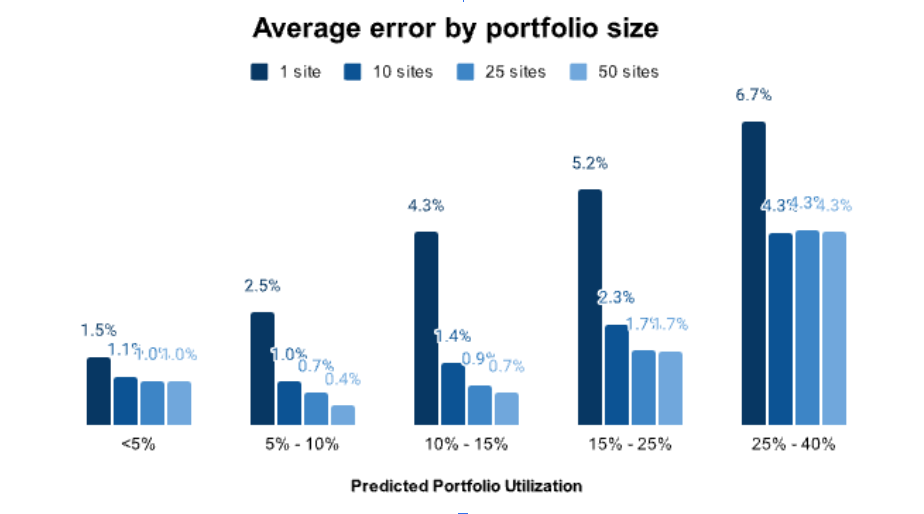
- For a 25-site portfolio with predicted utilization between 10 and 15 percent, average error drops to just 0.9 percentage points
- For portfolios in the 10 to 25 percent utilization range, average error is 1.7 percentage points
- As portfolio size increases from a single site to 50 sites, error rates decrease substantially, falling to well under 1 percent in many cases
This isn't a quirk of our methodology. It's basic statistics: diversification reduces prediction risk, just as it reduces investment risk. But it only works if your underlying model is unbiased, which is why we place so much emphasis on validating that our residuals center around zero.
Transparency as a competitive advantage
We publish our benchmarks regularly because we believe transparency builds trust. When you're making investment decisions that could span many years, you deserve to know exactly how forecasts are generated and how they've performed historically.
This transparency also keeps us accountable. By committing to regular benchmarks against live data, we create a feedback loop that continuously improves our models. Every update incorporates new training data, refines our features, and re-validates our predictions.
What this means for your decisions
If you're evaluating a single site, Stable’s forecasts give you an estimate grounded in real market data. Variance is inevitable, and it should be planned for.
If you're evaluating a portfolio, Stable’s forecasts become a powerful tool for risk-adjusted decision making. With portfolio-level errors under 2 percent for most utilization ranges, you can build financial models with genuine confidence.
And regardless of portfolio size, you can trust that our forecasts aren't systematically biased: they’re tested, measured, and revisited as real-world data comes in.
Ready to see how our forecasts can support your investment decisions? Get started with Stable Evaluate for free, up to five sites, to explore utilization and ROI potential across your target markets.
Schedule a demo
Schedule a 30-min time-slot with us directly, or send us a message if there's something else we can help with.